MakeeverySAPAIagentobservable-fromfirstprompttofinalaction.
Codemine Agent Telemetry Dashboard gives SAP teams a live control layer for AI agents, LLM calls, tool executions, retrieval steps, errors, latency, token usage, and business context - so every agent run can be monitored, explained, improved, and audited.
TraceanagentrunbyContextID.
AIagentscannotbeoperatedlikeclassicSAPreports.
SAP AI agents behave dynamically. One run may call an LLM, another may retrieve documents, trigger an MCP tool, call an SAP API, or stop because an authorization or grounding step failed. Standard logs show that something happened. Telemetry shows what happened, where it happened, why it failed, and what it cost.
Codemine Agent Telemetry Dashboard turns AI agent execution into a transparent operational view: every agent run is captured as a trace, enriched with SAP business context, and presented in a way SAP, integration, security, and AI teams can understand together.
Without telemetry, AI agents become a black box. With Codemine, every prompt, model call, retrieval step, tool execution, latency spike, failure, and cost driver becomes visible.
MeasurablecontroloverAIagentoperations.
Faster debugging
Find the exact failing step in a multi-step agent run instead of reading disconnected logs across AI Core, middleware, SAP APIs, and external tools.
Better agent reliability
Track failed, degraded, slow, and incomplete sessions. Spot recurring failure patterns before users lose trust in the agent.
Token and cost transparency
See which agents, prompts, tenants, tools, and models consume the most tokens - and where optimization has the highest impact.
Enterprise audit readiness
Keep a traceable record of agent runs, system calls, grounding steps, and execution outcomes for internal governance and compliance reviews.
Adoption insight
Understand which agents are actually used, by whom, in which process, and whether they complete the intended business task.
Architecture confidence
Use real production telemetry to decide whether to change model, prompt design, retrieval strategy, tool design, routing logic, or agent architecture.
Everyagentrun,explained.
Operations dashboard
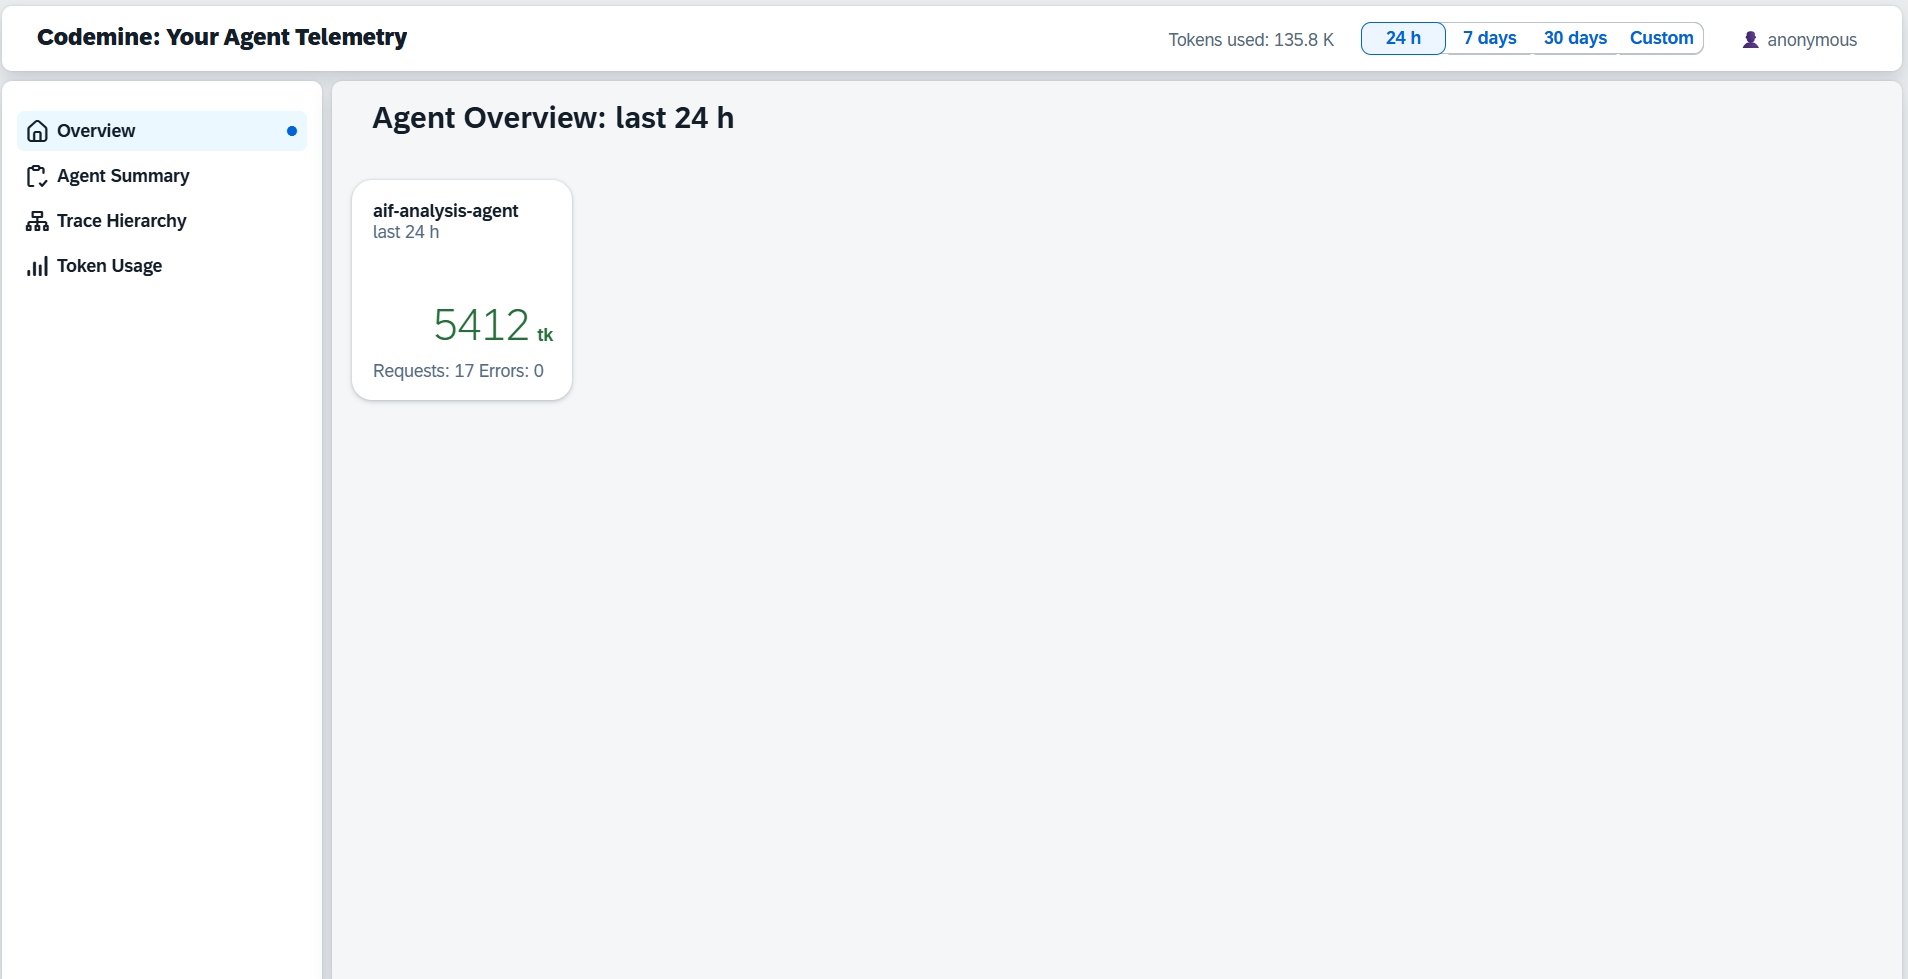
A single launchpad for SAP AI agent operations. KPI tiles show total sessions, token volume, requests, and errors across all active agents. Navigate to Agent Summary, Trace Hierarchy, or Token Usage from the left sidebar.
The cockpit view for AI operations: what is running, what is consuming tokens, and where errors are accumulating.
Agent Summary
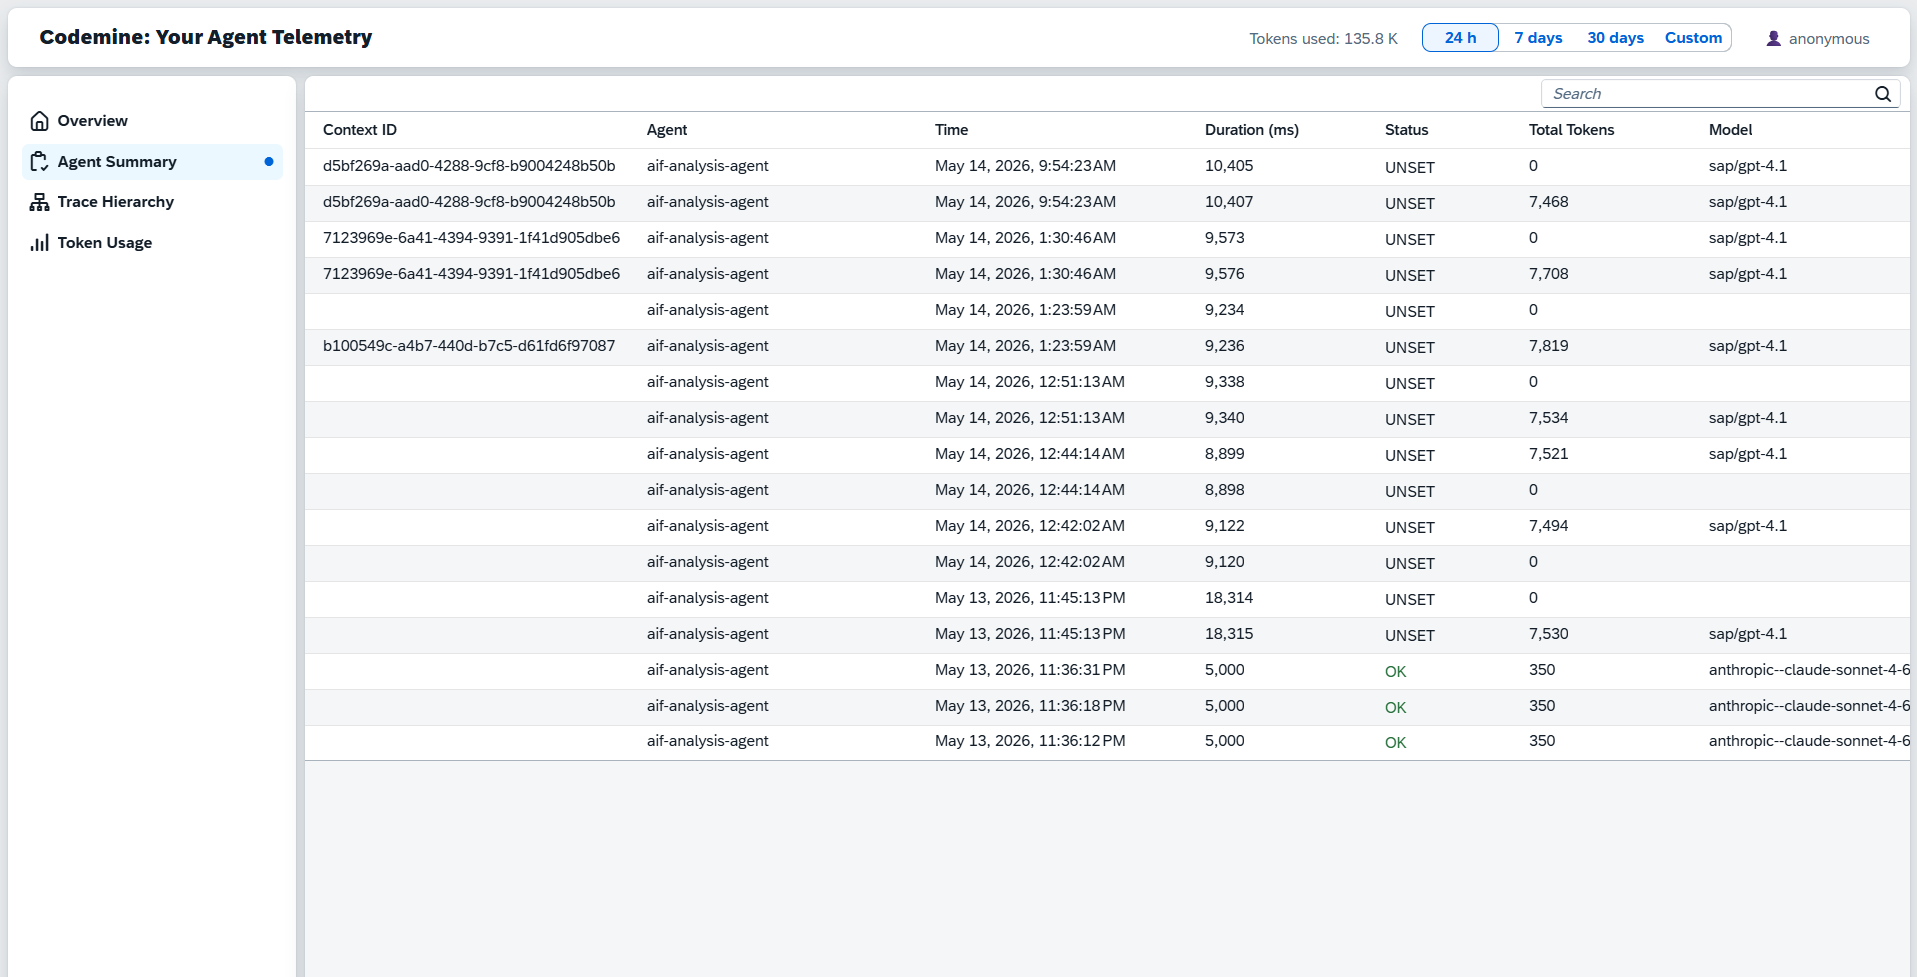
Every agent run logged in a table with Context ID, Agent, Time, Duration, Status, Total Tokens, and Model. Filter by time window, status, or agent. Use the Context ID column to find a specific run and trace it across the system.
Every run logged - scan the Context ID column to find and trace the exact run you need.
Trace Hierarchy
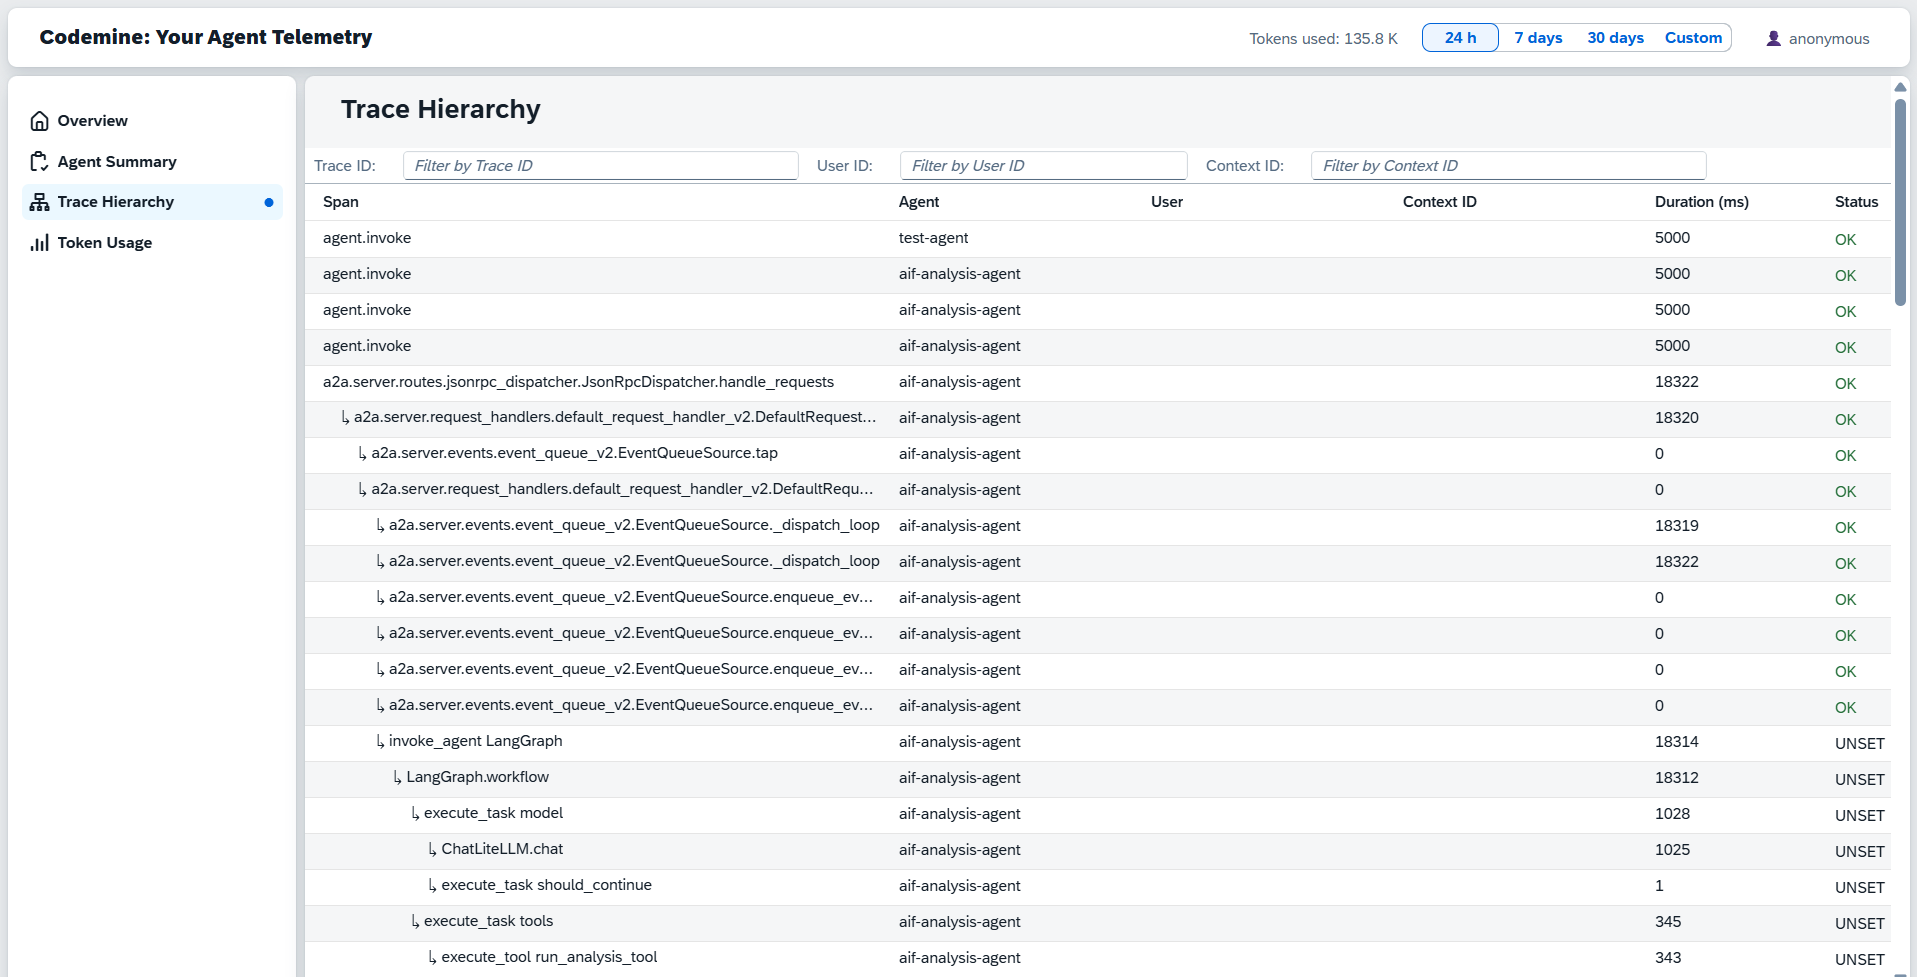
The full execution tree for any agent run: parent span at the top, child spans nested below. Filter by User ID or Context ID to isolate a specific conversation. Each row shows Span, User, Context ID, Duration, and Status.
Paste a Context ID into the filter - the complete execution tree for that run appears instantly.
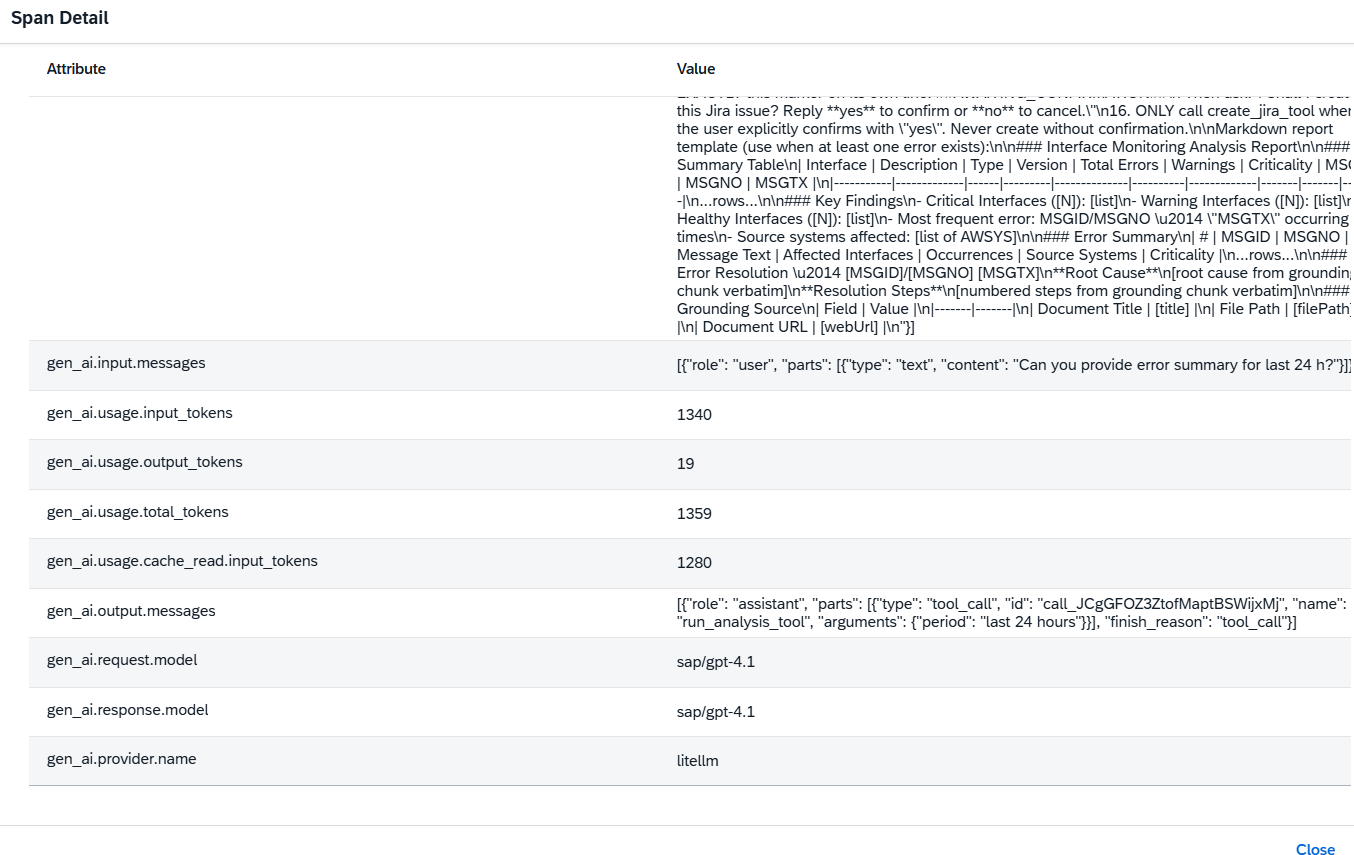
Span Detail
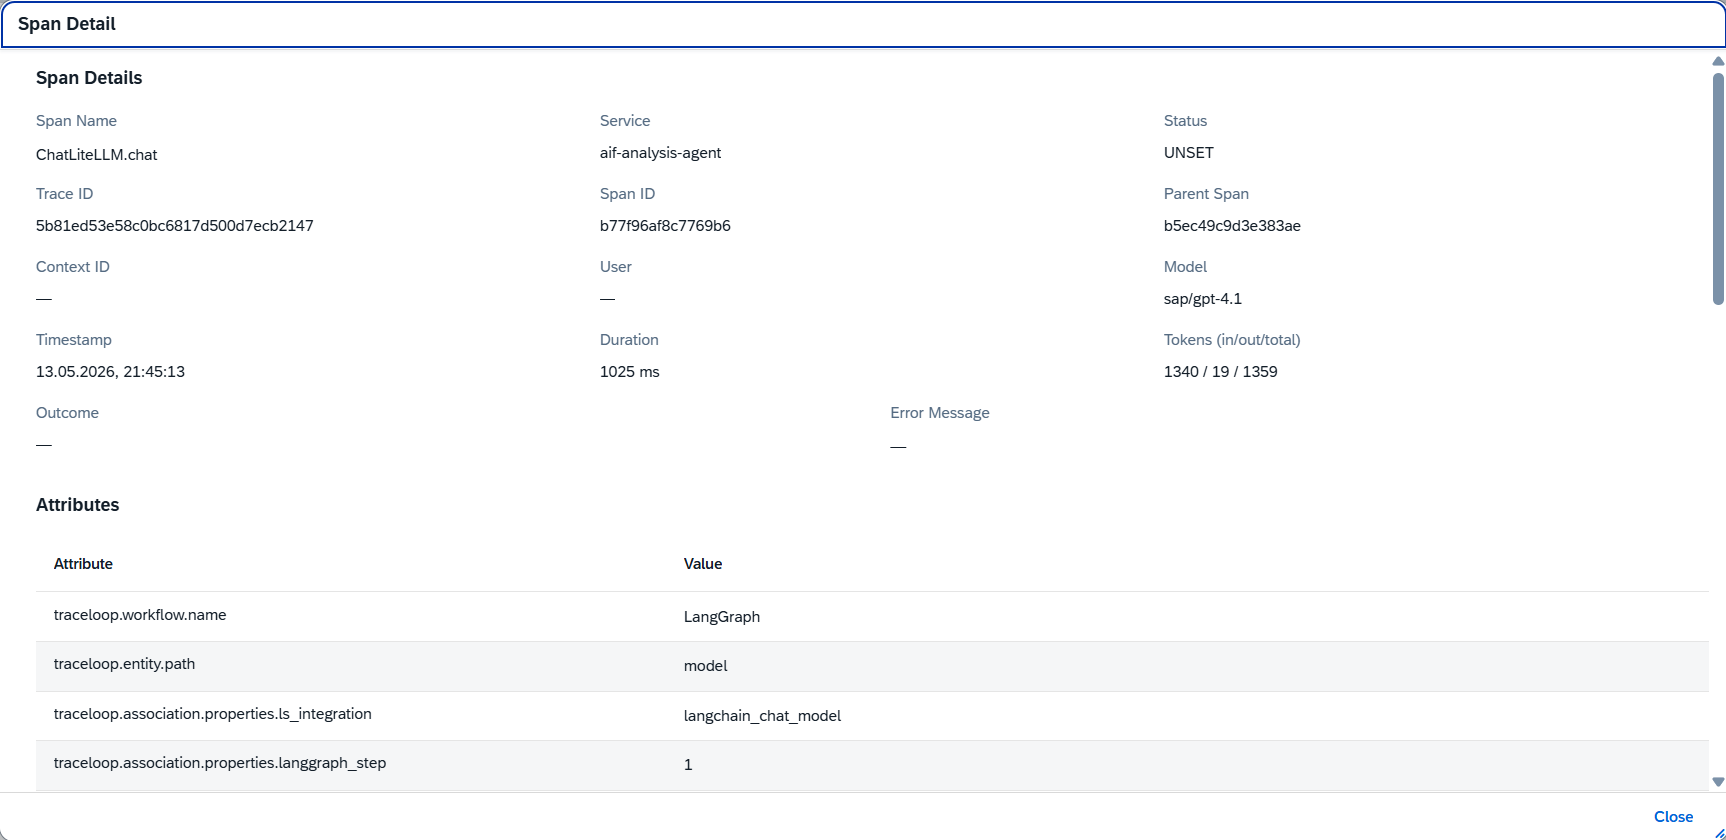
Click any span to open the detail view: Span Name, Service, Status, Trace ID, Span ID, Parent Span, Context ID, User, Model, Timestamp, Duration, and Token counts (in/out/total). The Attributes table below shows every OpenTelemetry attribute captured during that span.
Trace ID, Context ID, model, latency, and token breakdown - one span, all the context you need.
LLM Attributes
The Attributes section of each span captures the full OpenTelemetry GenAI semantic conventions: workflow name, entity path, input messages, token counts (input, output, total, cache), output messages with tool calls, model name, provider, and LangGraph step - everything needed to understand and reproduce the LLM call.
The full prompt, tool call output, token breakdown, and provider - captured as standard GenAI telemetry attributes.
Token Usage
A dedicated Token Usage view breaks down AI consumption by agent and time period. Each row shows Agent, Timestamp, Input Tokens, Output Tokens, and Total Tokens. Use this to identify which runs drive the highest token consumption and where model routing or prompt optimization would have the highest impact.
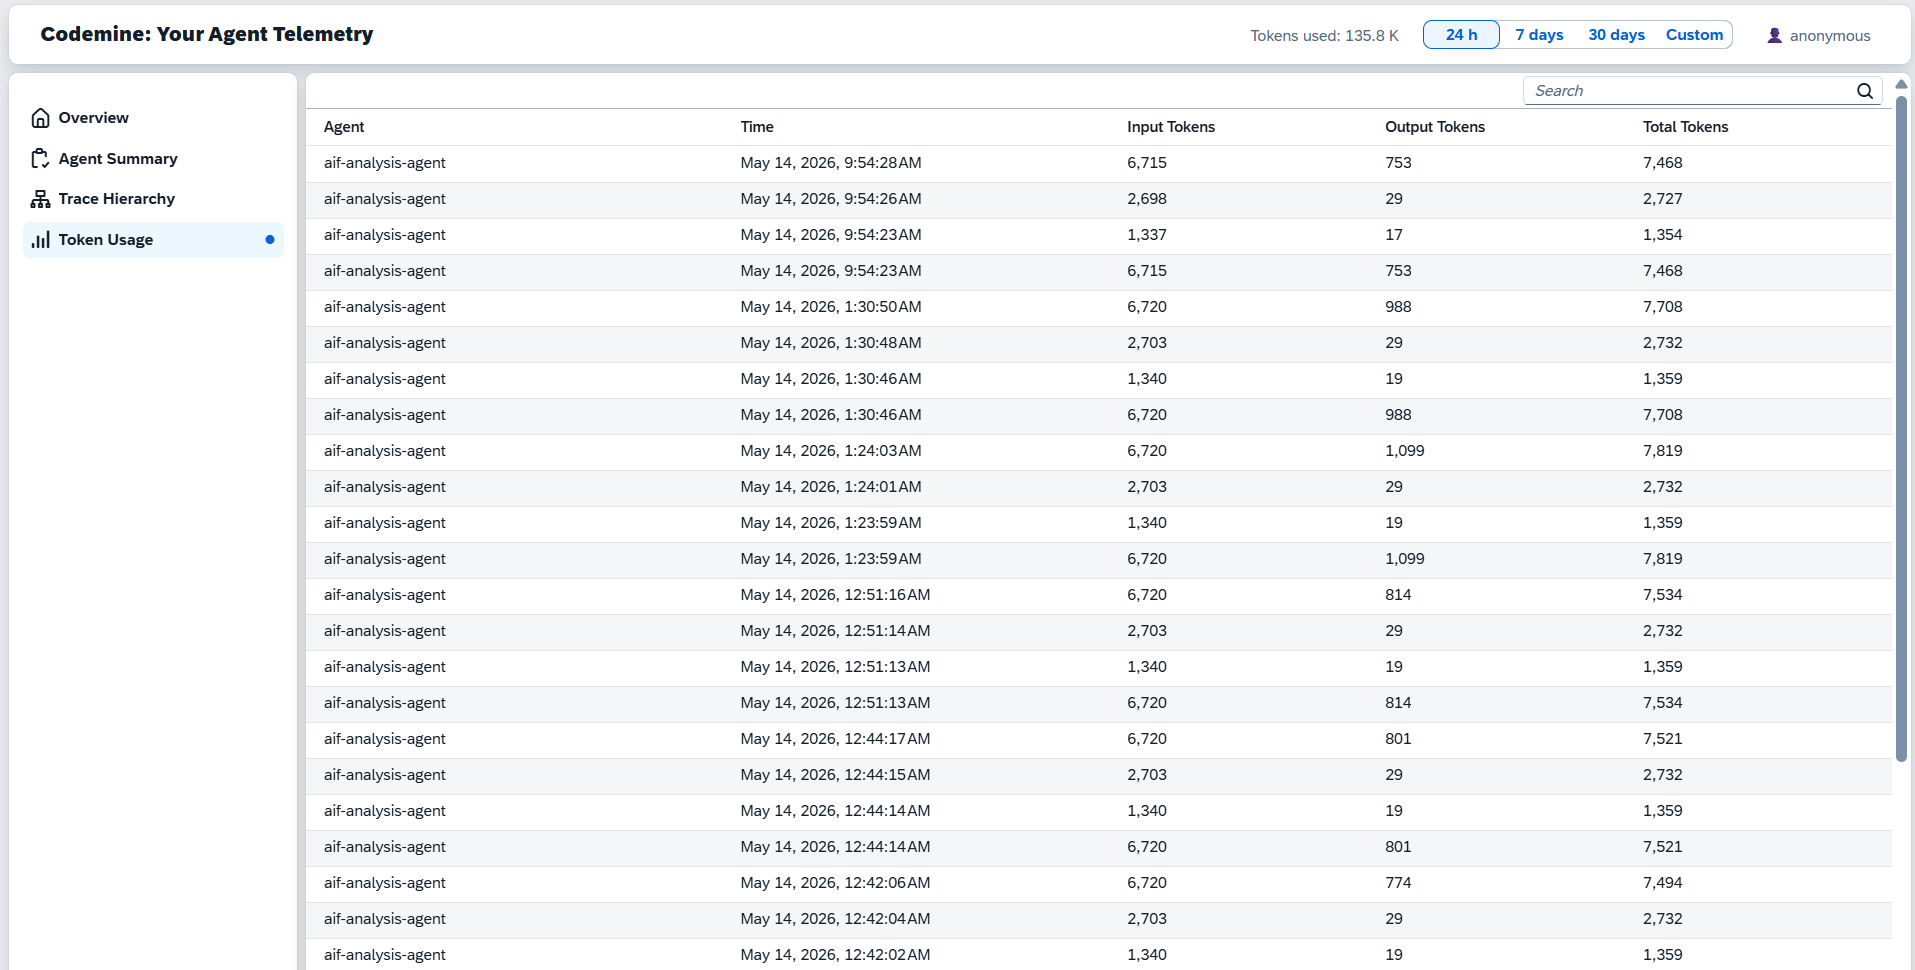
Move from "AI is expensive" to knowing exactly which agent run, prompt, and model call is driving the cost.
Whatthedashboarddoes.
FourstepstoobservableSAPAIagents.
Fromblack-boxAItooperationalcontrol.
BuiltforrealSAPAIoperations.
Joule and BTP agent monitoring
Observe custom SAP AI agents, Joule-connected skills, BTP multi-agent runtimes, and agent workflows across environments.
SAP interface and integration agents
Track agents that analyze AIF, IDoc, API, CPI, file, and middleware exceptions - including the steps they take to classify, explain, and route failures.
MCP and external tool governance
Monitor MCP servers and enterprise tool calls used by Claude, Copilot, Joule-connected agents, or custom SAP AI assistants.
AI cost governance
Identify expensive agents, prompts, tenants, and model choices before AI usage scales across the enterprise.
Production readiness for AI pilots
Turn a PoC into an operable product by adding telemetry, failure analysis, audit trails, and support visibility before rollout.
TelemetryarchitecturedesignedforSAPlandscapes.
Agent runtime
Joule Studio, SAP BTP, custom Python/Node.js agent, LangGraph, CAP service, Kyma workload, or external agent runtime.
Instrumentation layer
OpenTelemetry spans for agent invocation, LLM calls, retrieval, tool execution, workflow steps, SAP API calls, and errors.
Context layer
Tenant ID, user ID, conversation ID, agent name, SAP system, environment, business process, object ID, operation type, and custom customer attributes.
Export layer
OTLP-compatible export to the selected collector, observability backend, or Codemine telemetry storage.
Dashboard layer
Operational cockpit for AI agent runs, traces, failures, latency, token usage, cost, adoption, and remediation.
Security layer
Prompt and response redaction, data minimization, tenant-aware filtering, role-based access, and configurable retention.
BuiltonmodernAIobservabilitypatterns.
Startwithoneagent.Scaletothewholelandscape.
01
Telemetry readiness assessment
A short assessment of the current agent architecture, logging, privacy constraints, SAP context, runtime, and available observability tools.
Outcome
Telemetry blueprint and implementation roadmap.
02
Pilot dashboard for one agent
Instrumentation and dashboard setup for one productive or near-productive AI agent.
Outcome
Trace view, LLM call monitoring, token analytics, error classification, and basic operational cockpit.
03
Enterprise AI observability layer
A reusable telemetry architecture for multiple SAP AI agents, MCP servers, custom tools, and business processes.
Outcome
Standard span model, context model, dashboard templates, alerts, retention policy, and governance setup.